| 2019 | 2020 | 2021 | 2022 | (%) | 2023 | (%) | ||
| Own Employees |
||||||||
| Own Employees | Men | 3.774 | 3.444 | 3.857 | 3.772 | 21% | 4.064 | 82% |
| Woman | 624 | 631 | 832 | 806 | 4% | 904 | 18% | |
| Hourly Employees | Men | 1.234 | 1.143 | 1.017 | 926 | 5% | 710 | 89% |
| Woman | 128 | 131 | 134 | 120 | 1% | 92 | 11% | |
| Trainee | Men | – | – | – | – | – | – | – |
| Woman | – | – | – | – | – | – | – | |
| Interns and Apprentices |
||||||||
| Intern | Men | 73 | 87 | 95 | 113 | 1% | 114 | 48% |
| Woman | 91 | 96 | 136 | 134 | 1% | 124 | 52% | |
| Apprentice | Men | 63 | 37 | 29 | 17 | 0% | 17 | 16% |
| Woman | 39 | 31 | 93 | 87 | 0% | 89 | 84% | |
| Service Providers (third parties) |
||||||||
| Permanent | Men | 6.385 | 6.449 | 6.806 | 7.605 | 41% | 8.784 | 43% |
| Woman | 645 | 687 | 856 | 991 | 5% | |||
| Temporary | Men | 4.097 | 4.685 | 7.118 | 3.464 | 19% | 8.946 | 57% |
| Woman | 343 | 403 | 506 | 331 | 2% | |||
| Total | 17.496 | 17.824 | 21.479 | 18.366 | 100% | 23.844 | 100% | |
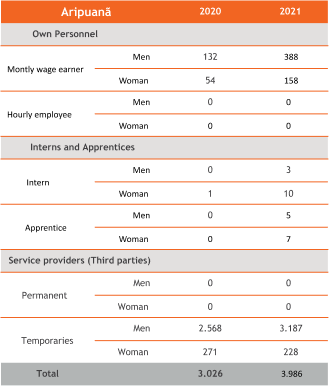
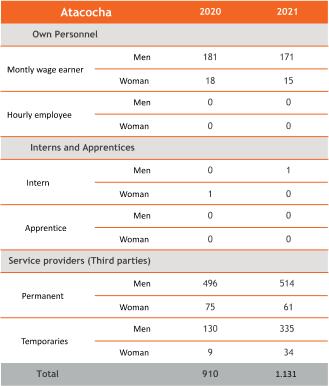
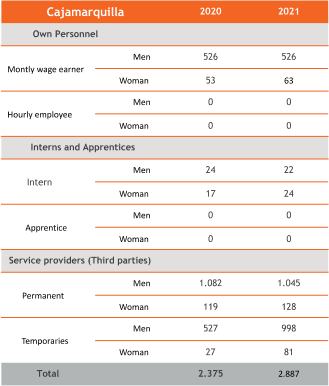
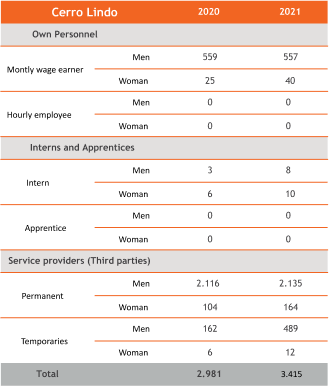
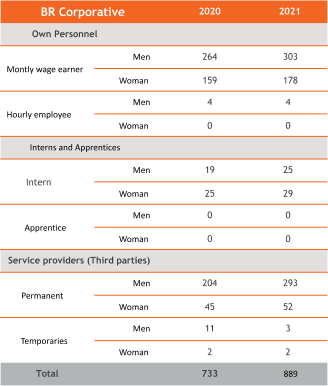
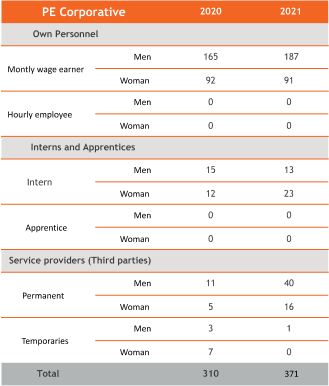
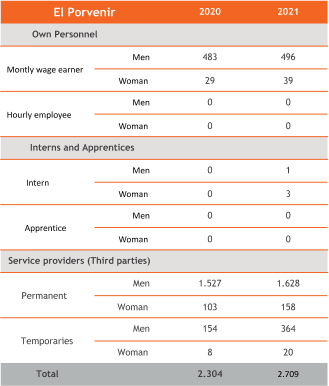
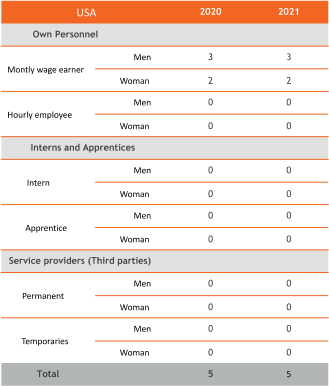
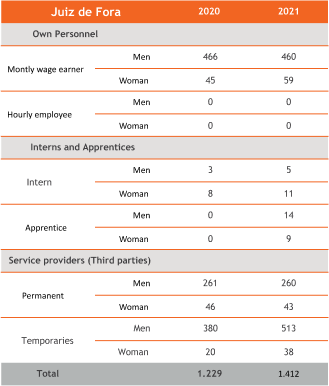
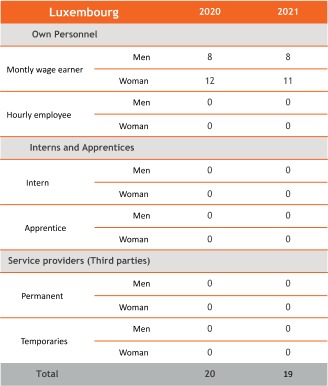
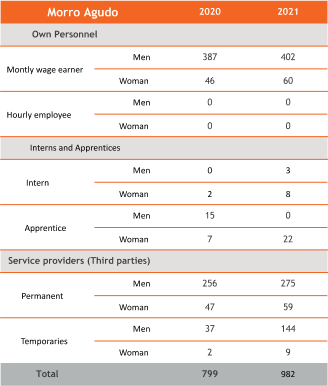
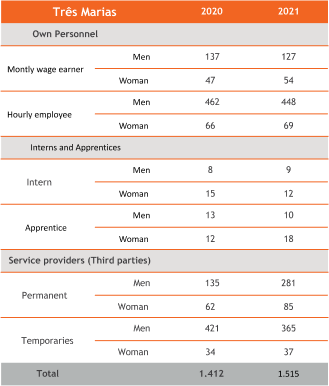
Confira nossos números por unidade em 2020 e 2021 (Dados não fornecidos para 2022):
